How to Generate Days between Two Dates in MySQL

Most of the time, as a web developer we're asked to generate a time-based report, such as daily or weekly report. For example, if we want to get sales report for March 2021, we'll do this MySQL query:
SELECT * FROM `sales` WHERE created_at BETWEEN '2021-03-01 00:00:00' AND '2021-03-31 23:59:59'But there's a catch. Sometime we want to display above query result in some kind of JS-based chart. Let's say we want to display the result in a morris.js chart. Based on the documentation, to display the chart in a line chart, we'll need to add these line within our <script> tag in the HTML file:
Morris.Line({
  element: 'area-example',
  data: [
    { y: '2006', a: 100 },
    { y: '2007', a: 75  },
    { y: '2008', a: 50  },
    { y: '2009', a: 75  },
    { y: '2010', a: 50  },
    { y: '2011', a: 75  },
    { y: '2012', a: 100 }
  ],
  xkey: 'y',
  ykeys: ['a'],
  labels: ['Series A']
});
The output from above script is below.
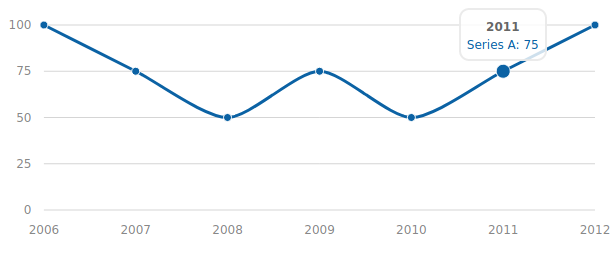
That should be no problem if we're displaying a yearly chart. How if we want to display daily chart? Let's try to display the chart using dummy data first:
Morris.Line({
  element: 'area-example',
  data: [
    { y: '2021-03-01', a: 100 },
    { y: '2021-03-02', a: 75  },
    { y: '2021-03-03', a: 50  },
    { y: '2021-03-06', a: 75  },
    { y: '2021-03-07', a: 50  },
    { y: '2021-03-08', a: 75  },
    { y: '2021-03-09', a: 100 }
  ],
  xkey: 'y',
  ykeys: ['a'],
  labels: ['Series A']
});
Notice the data jumps from '2021-03-03' to '2021-03-06'. Now let's check the chart output:
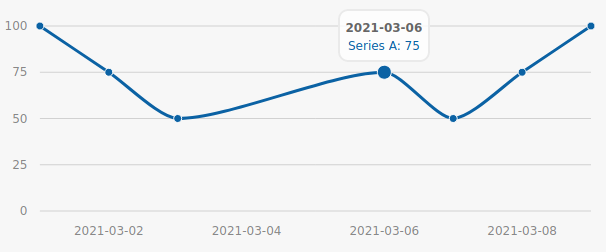
Now we know that we have an issue. Based on chart, we might assume that in 2021-03-04 and 2021-03-05, the values are somewhere between 50 an 75. This is misleading. In our case, it's a sales data. If we don't have sales record (row) for such date, it should means that there's no sale occurred on that date. So, the value must be set to 0 (zero).
How to generate a correct chart if the query result from database doesn't have a record for some dates? That's easy, here are the steps required:
- Get date list for such month.
- Joining the date with our data.
First, we need to generate dates of the report we want to show. Some people refer this table as tally table.
In this example, we'll use March 2021. As we know, March always have 31 days. So we'll use this query to generate the dates in March 2021:
SELECT a.the_date
FROM (
SELECT
'2021-03-31' - INTERVAL ( a.a + (10 * b.a) ) DAY AS the_date
FROM (
SELECT 0 AS a UNION ALL SELECT 1 UNION ALL SELECT 2 UNION ALL SELECT 3 UNION ALL SELECT 4 UNION ALL SELECT 5 UNION ALL SELECT 6 UNION ALL SELECT 7 UNION ALL SELECT 8 UNION ALL SELECT 9
) AS a
CROSS JOIN (
SELECT 0 AS a UNION ALL SELECT 1 UNION ALL SELECT 2 UNION ALL SELECT 3 UNION ALL SELECT 4 UNION ALL SELECT 5 UNION ALL SELECT 6 UNION ALL SELECT 7 UNION ALL SELECT 8 UNION ALL SELECT 9
) AS b
) a
WHERE a.the_date BETWEEN '2021-03-01' AND '2021-03-31'
ORDER BY a.the_dateASC
The result should be all the dates starts from 2021-03-01 until 2021-03-31:
2021-03-01
2021-03-02
2021-03-03
...
2021-03-29
2021-03-30
2021-03-31
Next, we must join the dates with data and move the ordering upward. Let's rewrite our above query:
SELECT date_list.the_date, IFNULL(sales.sales, 0) AS sales FROM (SELECT a.the_date
FROM (
    SELECT
		'2021-03-31' - INTERVAL ( a.a + (10 * b.a) ) DAY AS the_date
    FROM (
		SELECT 0 AS a UNION ALL SELECT 1 UNION ALL SELECT 2 UNION ALL SELECT 3 UNION ALL SELECT 4 UNION ALL SELECT 5 UNION ALL SELECT 6 UNION ALL SELECT 7 UNION ALL SELECT 8 UNION ALL SELECT 9
	) AS a
	CROSS JOIN (
		SELECT 0 AS a UNION ALL SELECT 1 UNION ALL SELECT 2 UNION ALL SELECT 3 UNION ALL SELECT 4 UNION ALL SELECT 5 UNION ALL SELECT 6 UNION ALL SELECT 7 UNION ALL SELECT 8 UNION ALL SELECT 9
	) AS b
) a
WHERE a.the_date BETWEEN '2021-03-01' AND '2021-03-31') date_list
LEFT JOIN sales ON date_list.the_date = sales.created_at
ORDER BY date_list.the_date ASC
The result are below:
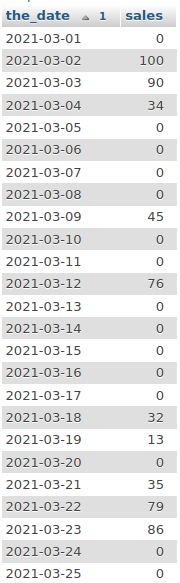
That's great. Now we have the correct data. Let's update our chart page:
Morris.Line({
  element: 'area-example',
  data: [
	{ y: '2021-03-01', a: 0   },
	{ y: '2021-03-02', a: 100 },
	{ y: '2021-03-03', a: 90  },
	{ y: '2021-03-04', a: 34  },
	{ y: '2021-03-05', a: 0   },
	{ y: '2021-03-06', a: 0   },
	{ y: '2021-03-07', a: 0   },
	{ y: '2021-03-08', a: 0   },
	{ y: '2021-03-09', a: 45  },
	{ y: '2021-03-10', a: 0   },
	{ y: '2021-03-11', a: 0   },
	{ y: '2021-03-12', a: 76  },
	{ y: '2021-03-13', a: 0   },
	{ y: '2021-03-14', a: 0   },
	{ y: '2021-03-15', a: 0   },
	{ y: '2021-03-16', a: 0   },
	{ y: '2021-03-17', a: 0   },
	{ y: '2021-03-18', a: 32  },
	{ y: '2021-03-19', a: 13  },
	{ y: '2021-03-20', a: 0   },
	{ y: '2021-03-21', a: 35  },
	{ y: '2021-03-22', a: 79  },
	{ y: '2021-03-23', a: 86  },
	{ y: '2021-03-24', a: 0   },
	{ y: '2021-03-25', a: 0   },
	{ y: '2021-03-26', a: 0   },
	{ y: '2021-03-27', a: 22  },
	{ y: '2021-03-28', a: 0   },
	{ y: '2021-03-29', a: 0   },
	{ y: '2021-03-30', a: 0   },
	{ y: '2021-03-31', a: 0   }

  ],
  xkey: 'y',
  ykeys: ['a'],
  labels: ['Series A']
});
And the output is:
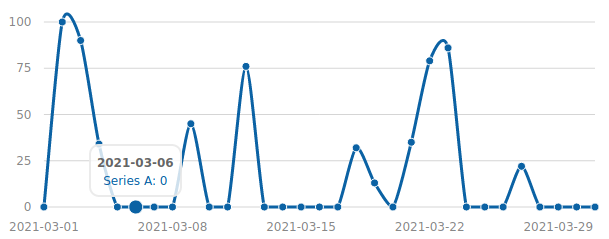
That's seems like it. Next, I'll show you how to do get a list of months or between two dates in MySQL. Stay tune.
Final Words
I hope that you now know how to generate days between two dates in MySQL. If you run into any issues or have any feedback feel free to drop a comment below.